Today I needed to create a graph for my upcoming book Robotics at Home with Raspberry Pi Pico. After spending time in Inkscape and seeing this was not the way, I reached to Jupyter notebooks with matplotlib.
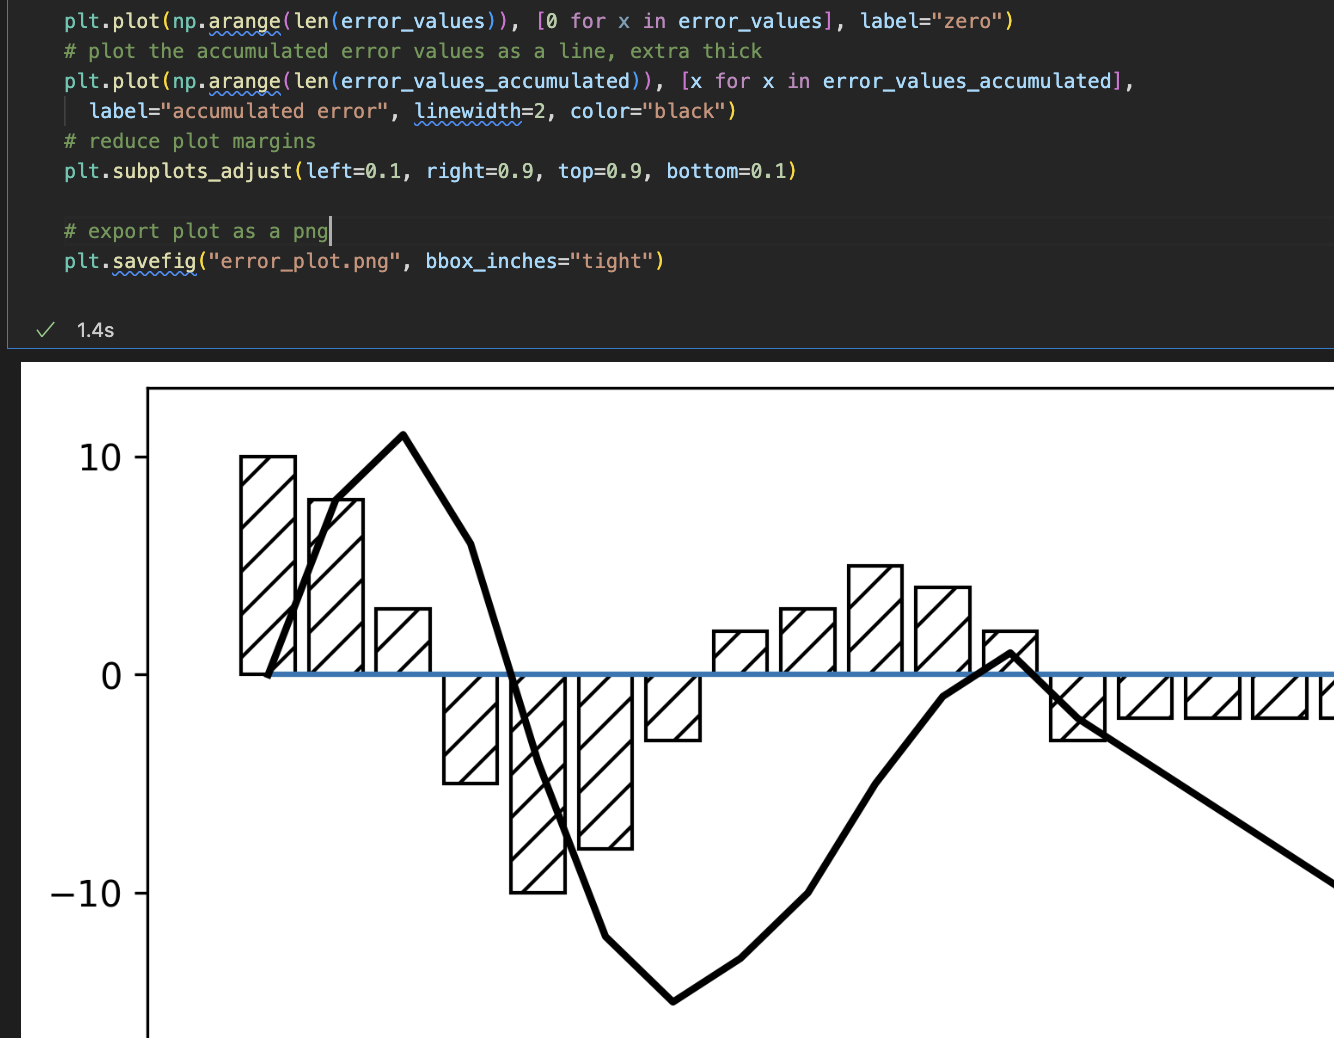
VSCode has had good ipynb integration for some time, rendering the plots from Matplotlib and loading the kernel. Matplotlib has many options to customise graphs. Looking those up in the documentation can take some time. But copilot here is a game changer, predicting really well what I meant. Using it made putting together graphs demonstrating errors and integrals together really easy.
 I recommend if you have graphing needs to try this killer combo!
If you’ve not come across it yet, Copilot is an AI enabled system to predict code. It will synthesize code based on what you’ve already typed, even comments. It’s not out to steal your job, but will make it easier by filling in what you intend once you start typing it. Like code inference autocomplete but done really well.